Palm oil price stability amid crude oil volatility
August 4, 2026
1 RM (Malaysian Ringgit) = 0.24 USD
1 USD = 0.74 GBP
*Exchange rates calculated and market prices reported on August 4, 2026
Crude Palm Oil
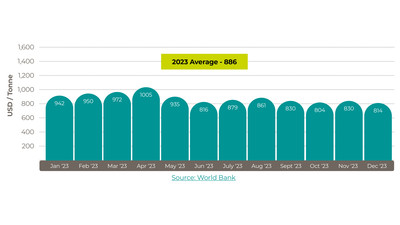
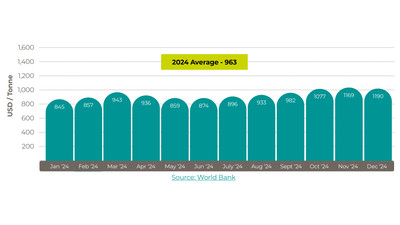
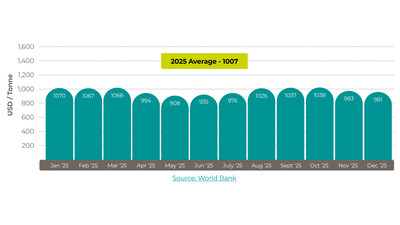
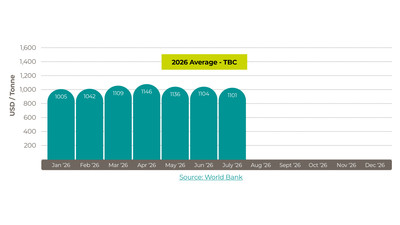
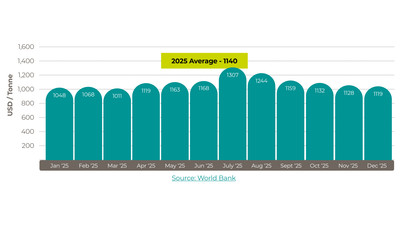
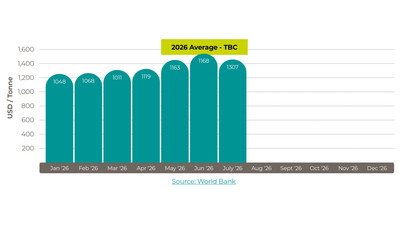
Average World Bank July 2026 palm oil price
US$1101/tonne (-US$3 in the month, a decrease of 0.3%)
Malaysia palm market
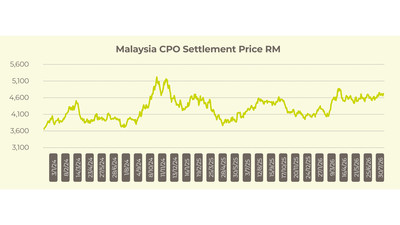
Stability reigns in palm oil market in July
July was a relatively stable month for Malaysian palm oil prices, although there were some reactions to external forces, including the continuing tension in the Middle East.
The Malaysian Palm Oil Settlement price started the month at RM4,554/tonne (US$1,093) and ended it 2.3% higher at RM4,659/tonne (US$1,118). In the intervening period, it reached a high of RM4,713/tonne on 24 July and a low of RM4,483/tonne (US$1,075) on the 3rd of the month.
There were signs of a small strengthening of prices into August. On 4 August, the price was RM4,689/tonne (US$1,125). That was 4.6% more than the month before, 15.4% more than the year before, but 34% less than the all-time high in April 2022.
The palm oil price was much more stable than the crude oil price in July. The Brent crude oil price swung from a low of US$71 a barrel in early July to a high of US$100 by the 24th of the month before slipping. By 4 August it was at US$85 a barrel, according to Trading Economics.
Vegetable oil
July prices slip in line with lower oil values
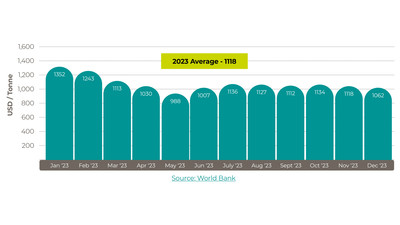
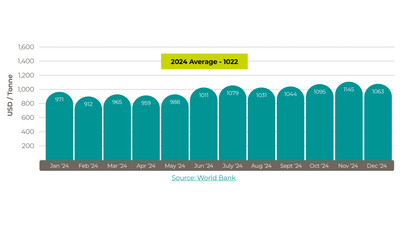
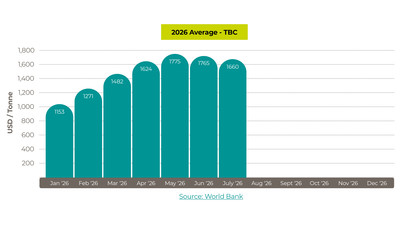
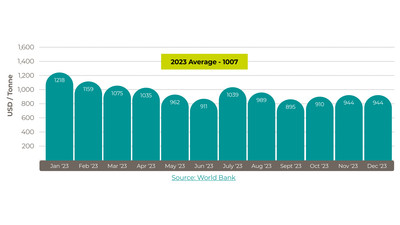
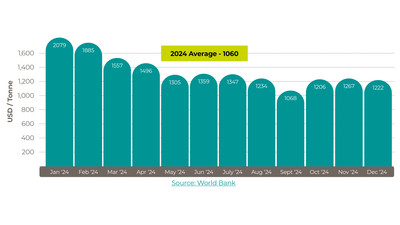
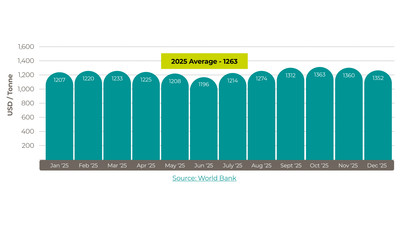
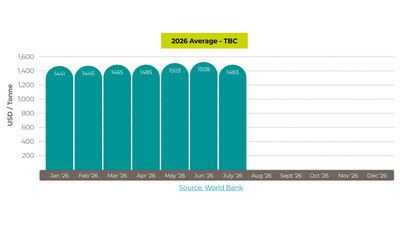
Vegetable oil prices drifted down in July, with the global palm oil price down 0.3% in the month, but up 12.8% over the year to US$1,101/tonne, according to the World Bank. The soybean oil price was down 4.6% in July but up 27% over the year to US$1,660/tonne, while rapeseed and sunflower oil prices were 1.8% and 1.7% down respectively over the month, but up by more than 20% over the year. The crude oil price fell 2.3% in July and was up 15.3% over the year to US$79.8 a barrel.
Global oilseed production for the 2026/27 season is increased by 1.8 million tonnes or 0.25% to 720.0 million tonnes, driven by higher rapeseed, sunflower seed, soybean, and cottonseed production, according to the US Department of Agriculture. That figure would be 2.7% more than last season. Production of vegetable oils is increased by 0.25% to 244.7 million tonnes, 2.6% more than last season. A 3.4% year-on-year increase in global vegetable oil trade and a 3% increase in usage would leave stocks of 31.0 million tonnes, 0.6% more than last season.
Larger areas of rapeseed in Russia and the US helped push up production. Russia should also see extra sunflower seed production, although Ukraine’s output is expected to be down. A 0.4 million tonnes increase in soybean production is also expected because of larger areas in the US and Canada.
The weather will continue to influence production, with the US experiencing hot conditions and very high temperatures and low rainfall across many parts of Europe. The strengthening El Niño weather pattern could influence southern hemisphere production in the coming months.
Soybean oil
Rapeseed oil
Sunflower oil
Shipping update
Costs come off their July peak but still elevated
Shipping costs peaked in early July and started to fall, but remain at levels that are much higher than last year. By 9 July, the Drewry World Container Index was at US$4,639 per 40-foot container. That was 31% more than it had been the month before and more than double the February 2026 cost.
By 30 July the index had fallen 3% in the week to US$4,255 per container. That was 8.3% less than the 9th of July peak.
From the 30 July, 2026 Drewry World Container Index report:
- The Drewry World Container Index (WCI), the benchmark widely referenced by procurement teams, decreased 3% to $4,255 per 40-foot container, driven by a decrease in rates on Asia–Europe and Transpacific trade routes.
- On the Transpacific trade route, spot rates from Shanghai to Los Angeles declined 2% to $5,739 per 40-foot container, while rates from Shanghai to New York held steady at $7,578 per 40-foot container. Following softening demand and the slowdown in front-loading activity, carriers are actively managing capacity through blank sailings. According to Drewry's Container Capacity Insight, eight blank sailings are scheduled for next week, up from seven this week, resulting in a decrease in available capacity in the market. As a result, Drewry expects the volatility in rates to reduce in the coming week.
- On the Asia–Europe trade route, spot rates declined 6% to $5,630 per 40-foot container from Shanghai to Genoa and decreased 3% to $4,677 per 40-foot container on Shanghai to Rotterdam. With demand continuing to ease, carriers are focusing on capacity management through blank sailings to prevent further rate erosion. According to Drewry’s Container Capacity Insight, three blank sailings are scheduled on the Asia–Europe trade lane next week, compared to four this week. As carriers continue to manage available capacity, Drewry expects rates to remain stable in the next week.
- The East–West container freight market remained under pressure, as demand continued to soften following the implementation of new US tariff measures. Geopolitical tensions in the Middle East have prompted several carriers to introduce Emergency Fuel Surcharges (EFS) effective from August, while carriers across major trade lanes continue to manage capacity through blank sailings and service adjustments. Ongoing uncertainty surrounding global trade policies, geopolitical developments, and port congestion is expected to influence market conditions and freight rate trends in the coming weeks.
Source: Drewry Supply Chain Advisors
Disclaimer: The information in this document has been obtained from or based upon sources believed to be reliable and accurate at the time of writing. The document should be for information purposes only and is not guaranteed to be accurate or complete.