October 2, 2023
Crude palm oil decreases, global container rates decrease by 19%
1 RM (Malaysian Ringgit) = 0.21 USD
1 USD = 0.82 GBP
*Exchange rates calculated and market prices reported on September 29
Crude Palm Oil
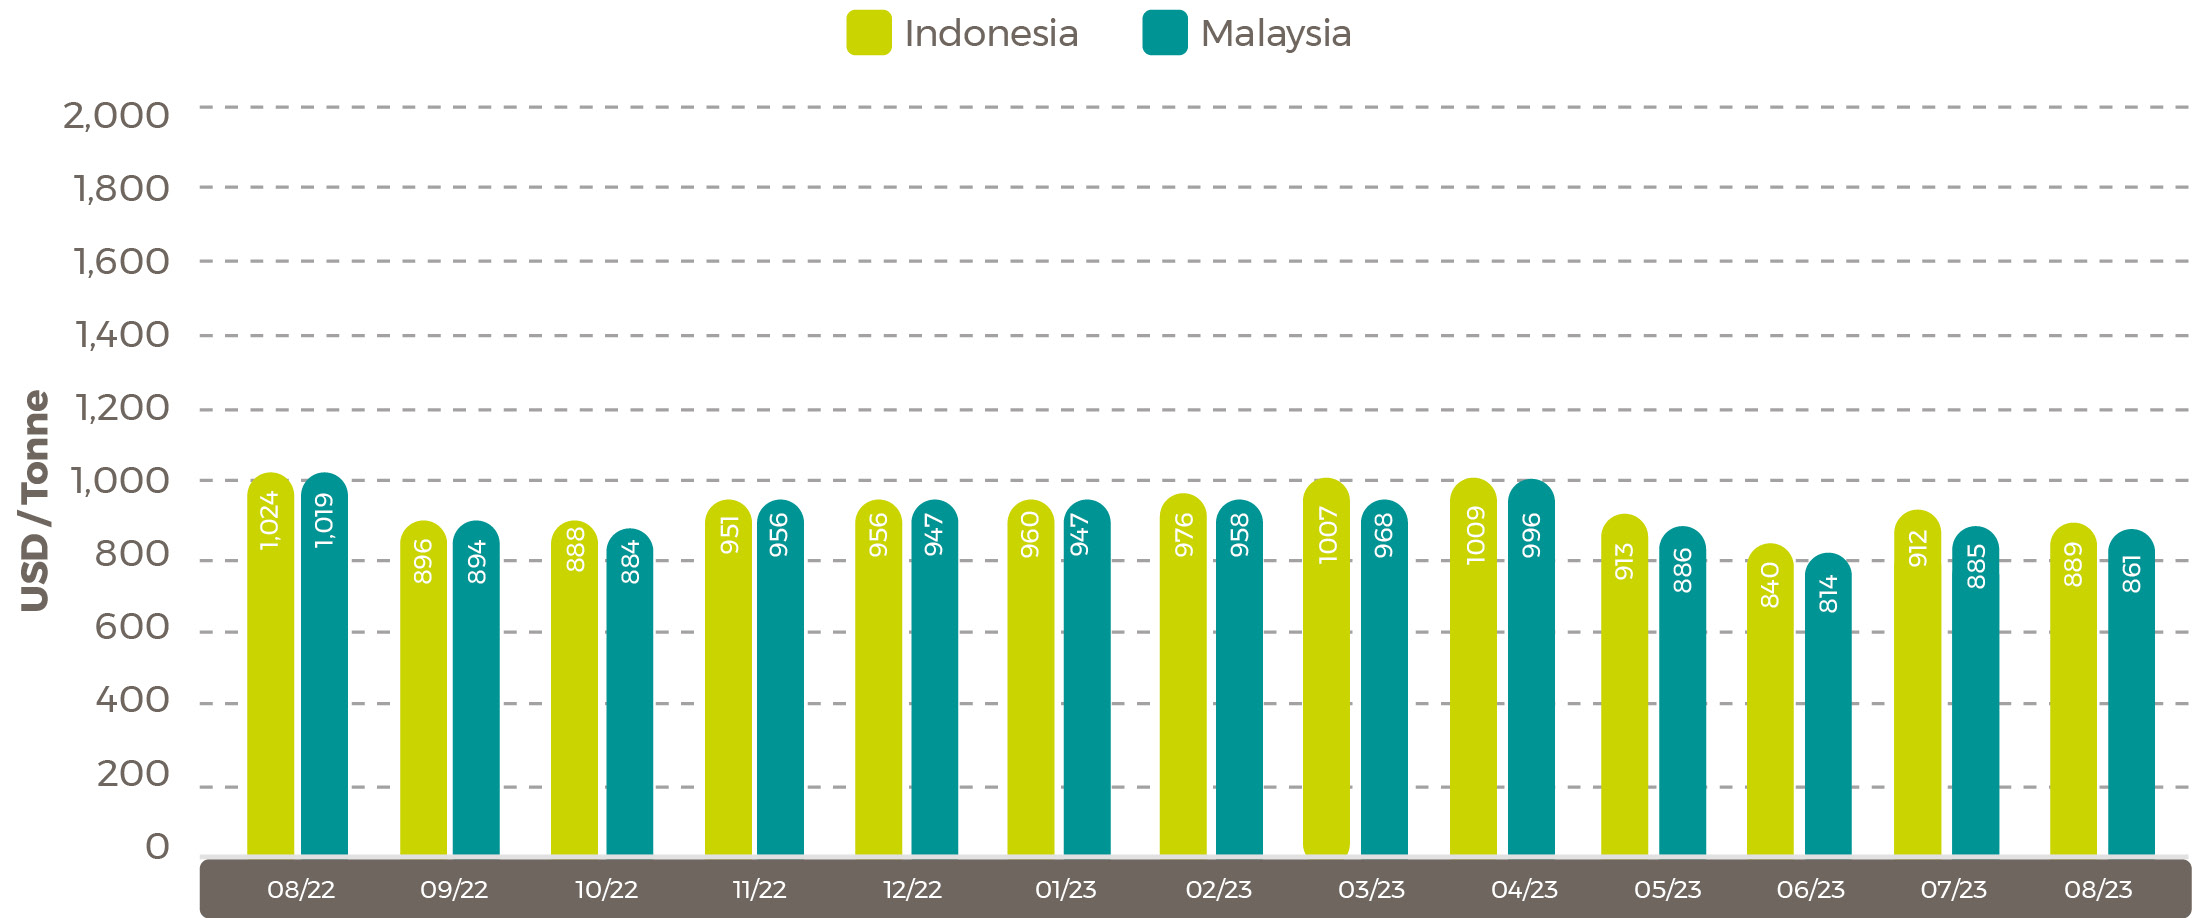
Average August Palm Oil Export Prices
-
Indonesia
$889 tonne (-$23/tonne -
Malaysia
$861/tonne (-$23/tonne)
Source: USDA Foreign Agricultural Service
Malaysia palm market
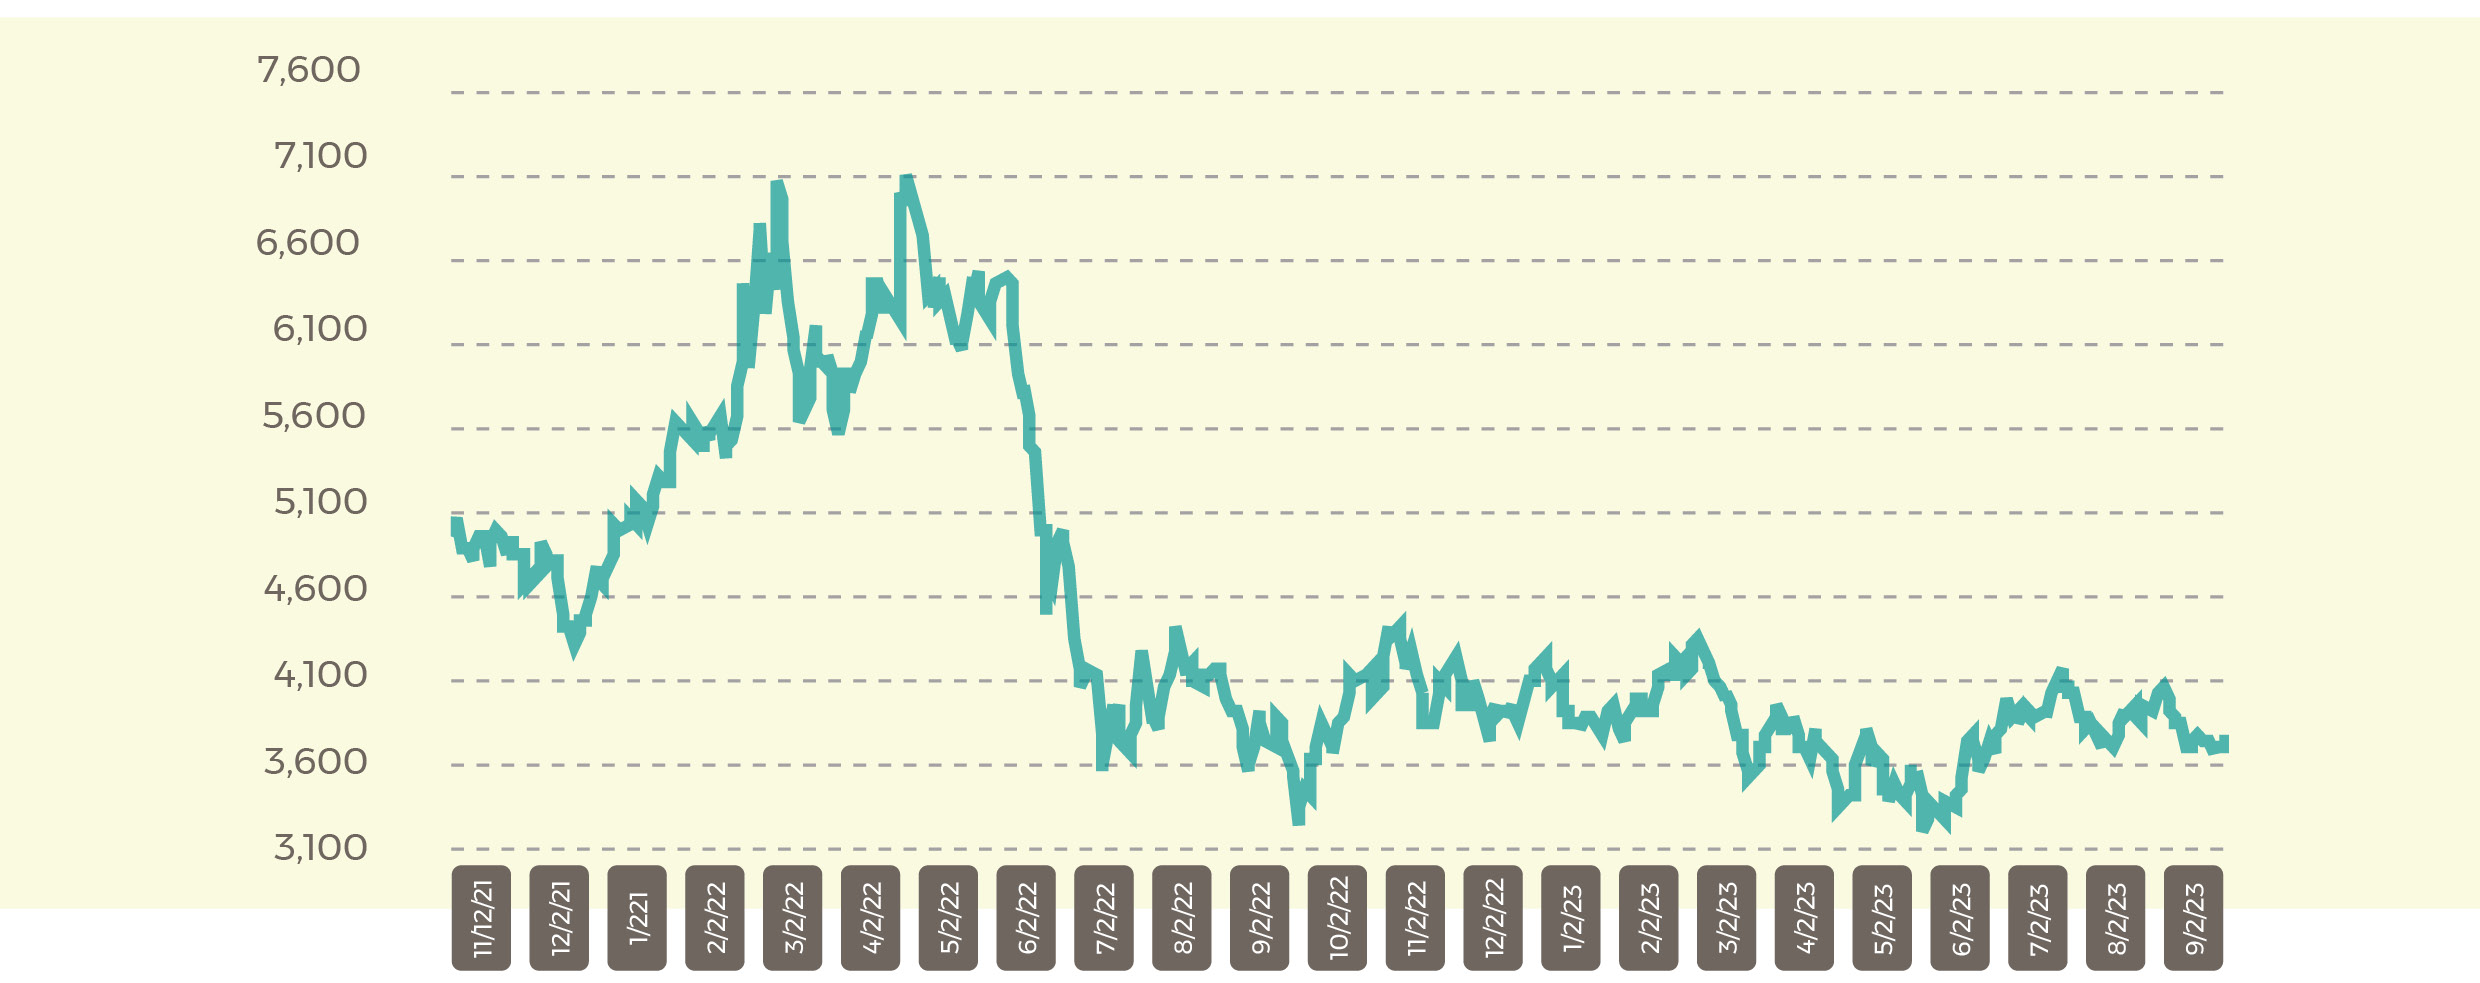
The monthly average for Malaysia’s Crude Palm Oil (CPO) settlement price has declined for a second month to 3,748 RM/tonne ($799.06) in September following a high of 3,952 RM/tonne ($842.55) in July.
September started with a high of 4,040 RM/tonne ($861.32) on the 1st, ending September 27 at 3,771 RM/tonne ($803.97). September was a volatile month, seeing a low of 3,678 RM/tonne ($784.14) on September 21.
Malaysia CPO Settlement Price RM
Soybean oil
August 2023 Soybean Oil Export Prices $/tonne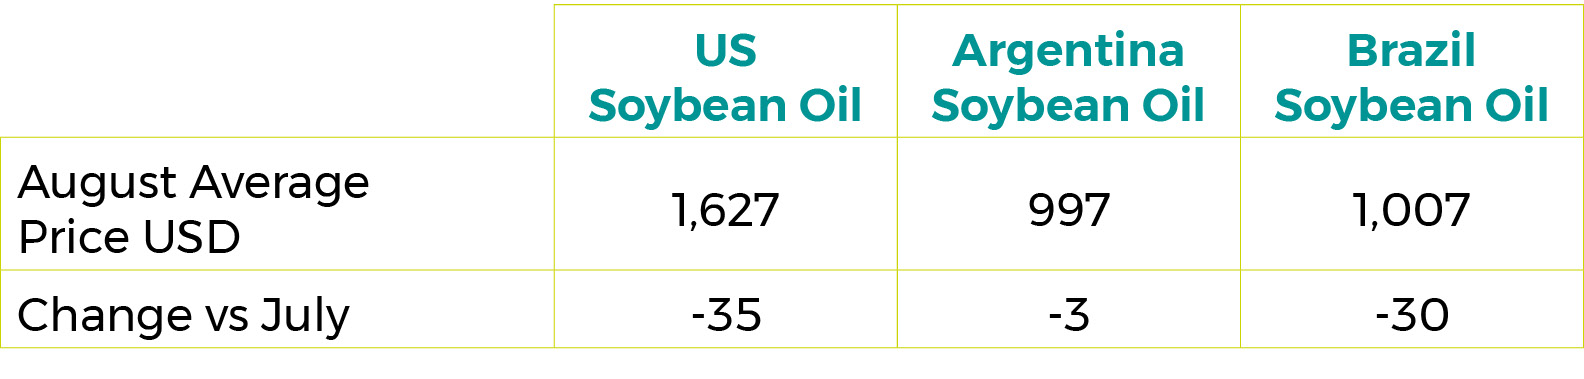
Soybean oil export prices decrease
According to USDA, soybean oil decreased as a result of a weaker vegetable oil market lowering competitive oils.
“Soybean oil pricing fundamentals followed ups and downs in both crude oil and weather concerns for soybeans, but averaged lower on the month. Other major vegetable oils were down on large inventories for rapeseed and sunflowerseed oils and higher production expectations for palm oil, further supporting the decline in soybean oil prices,” says USDA
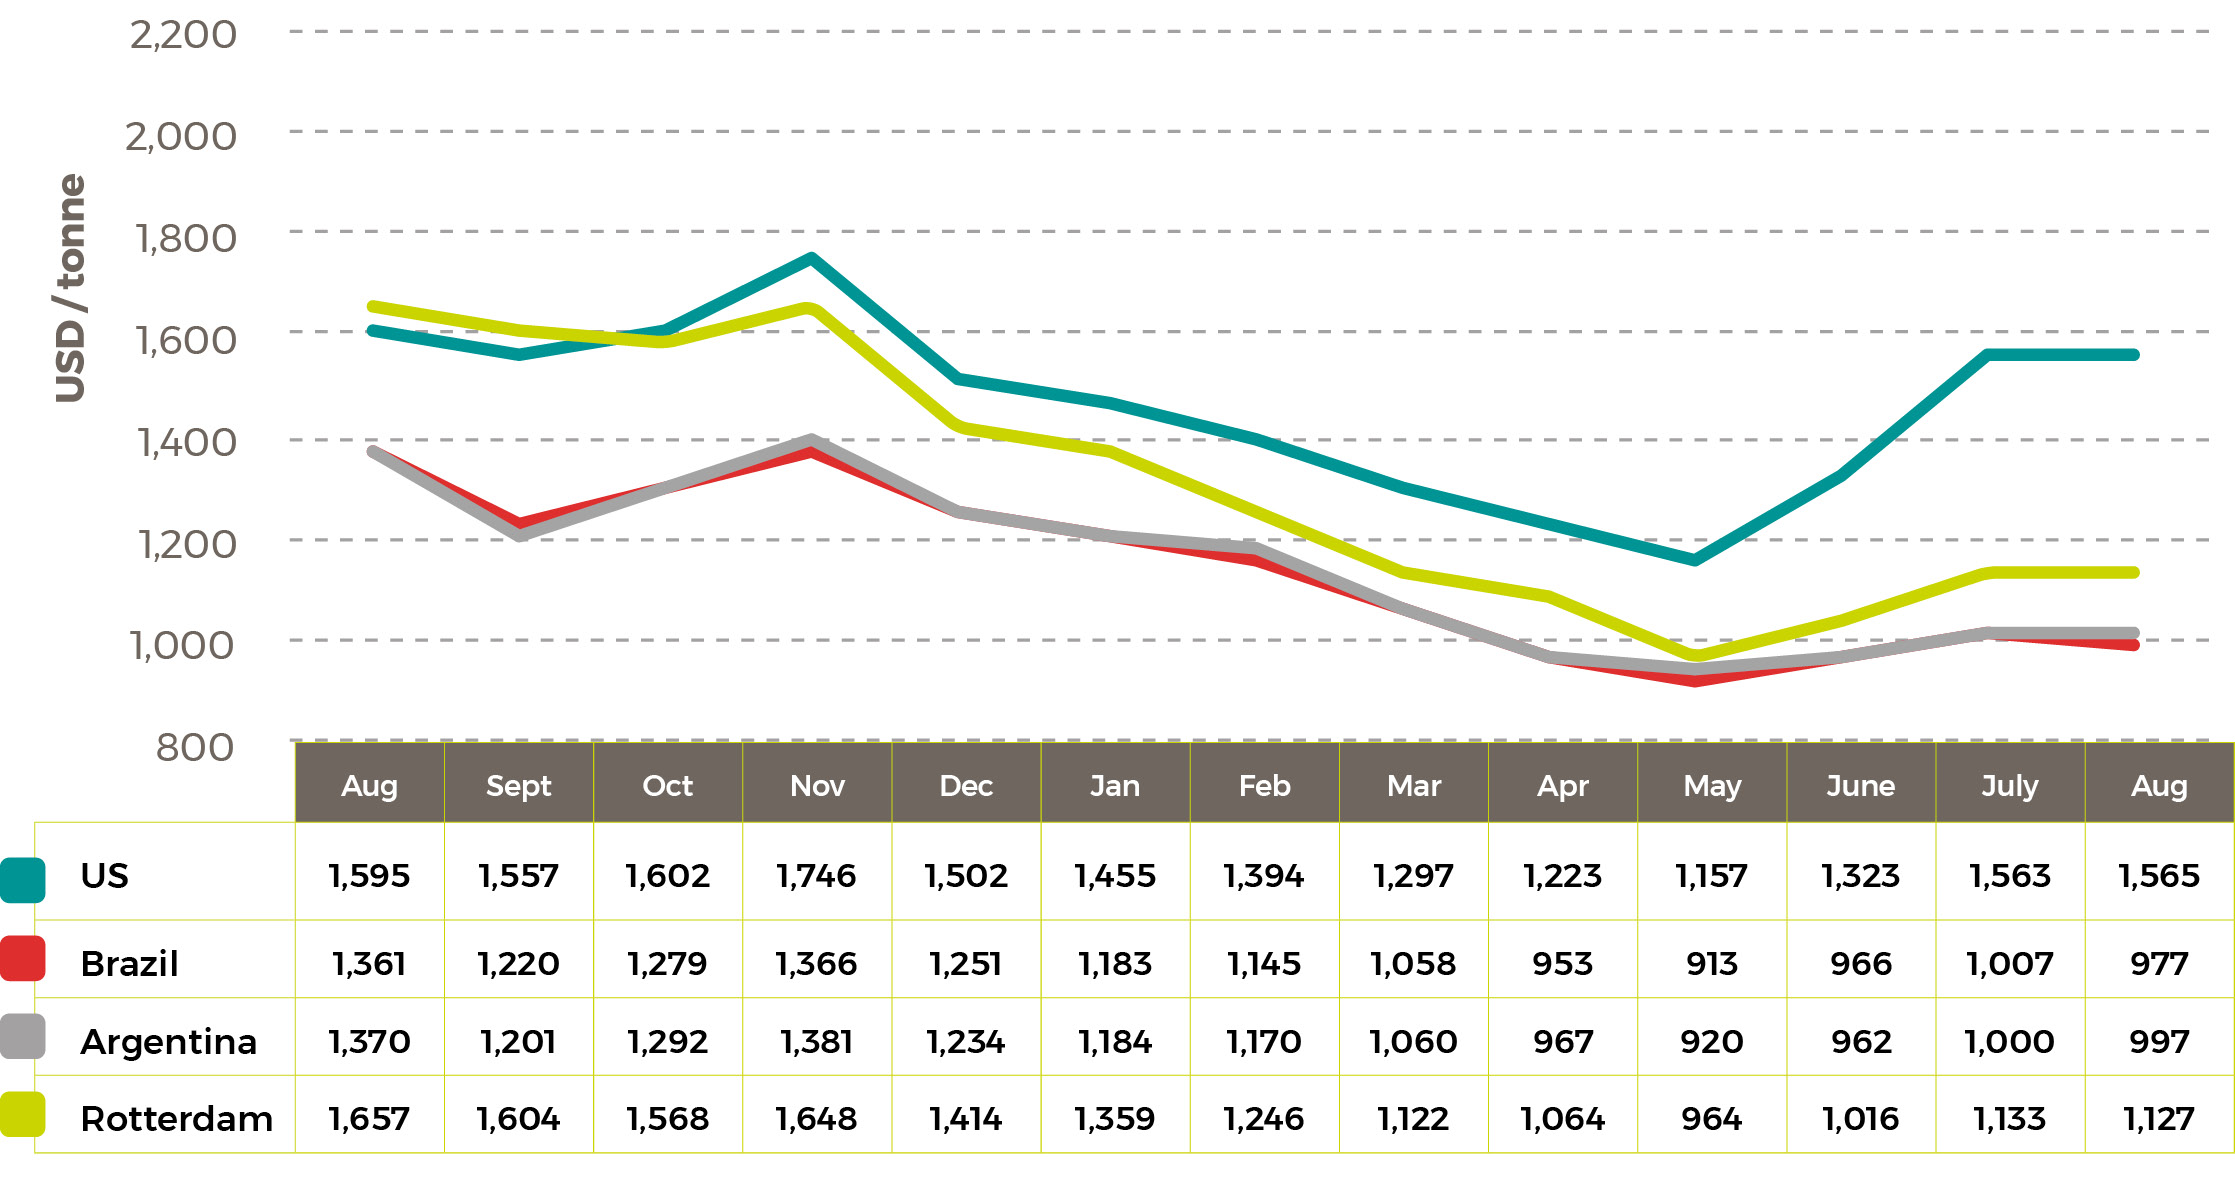
Average 2021/23 Soybean Oil Prices $/tonne
Rapeseed oil
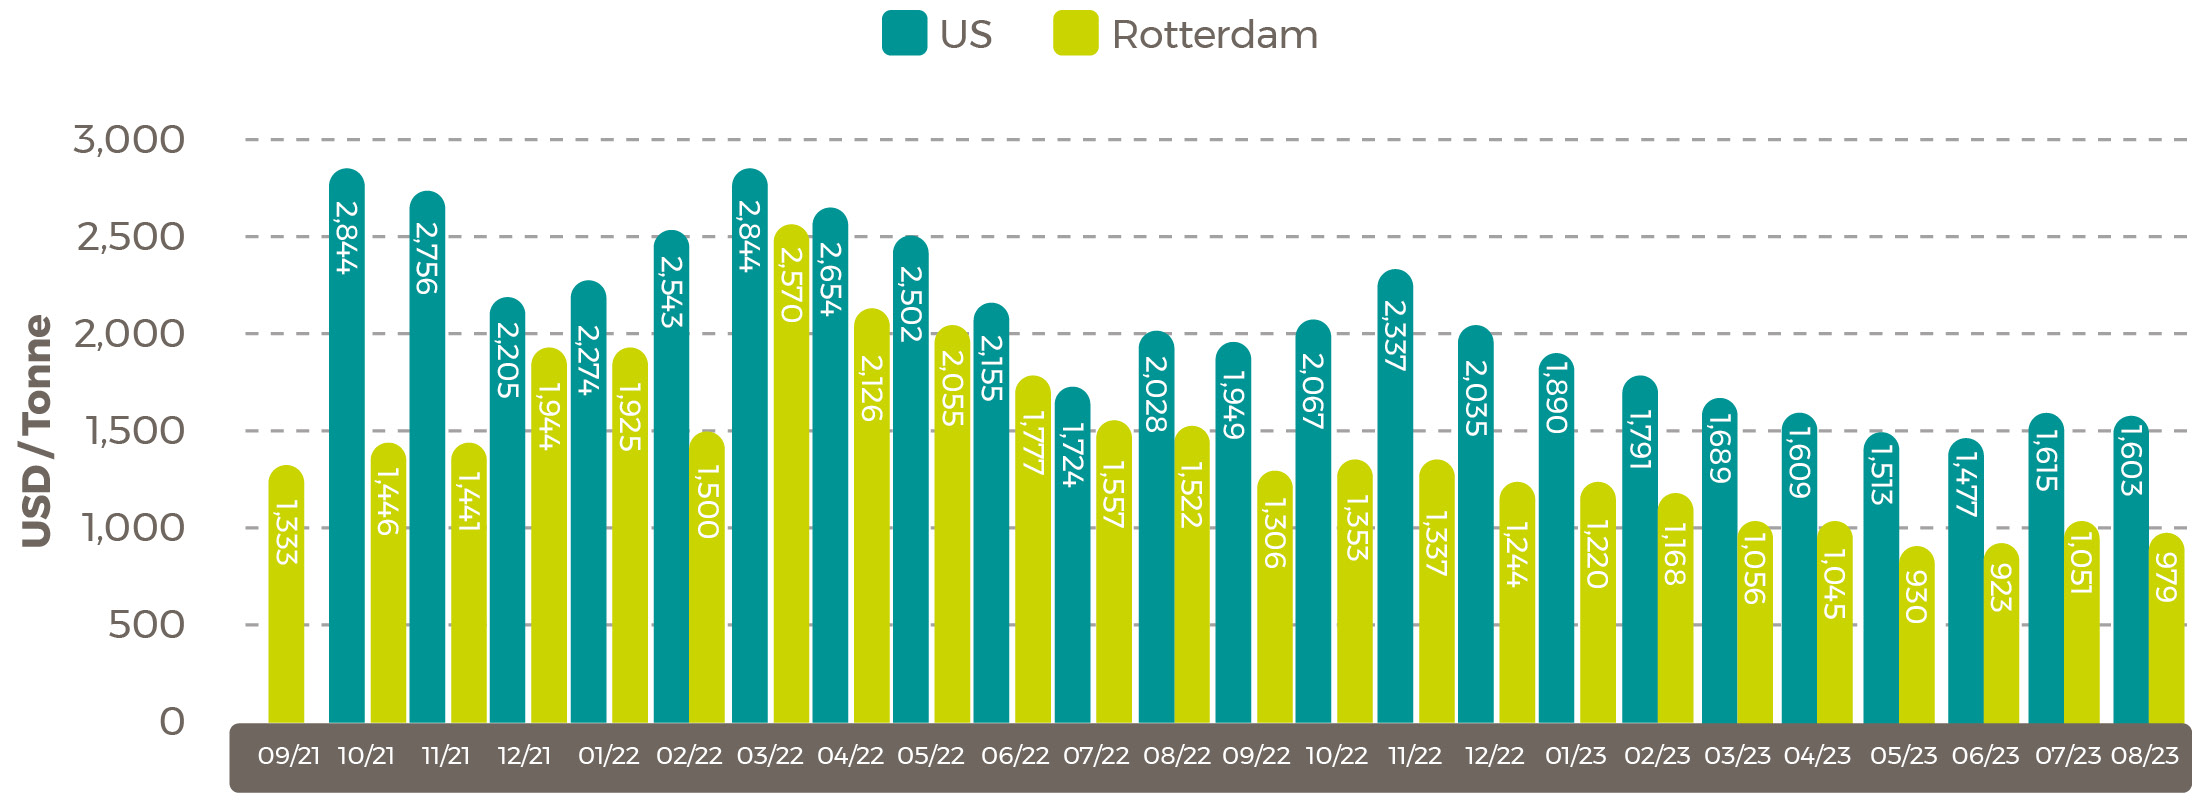
Average 2021/23 Rapeseed Rotterdam (Canola) Oil Prices $/tonne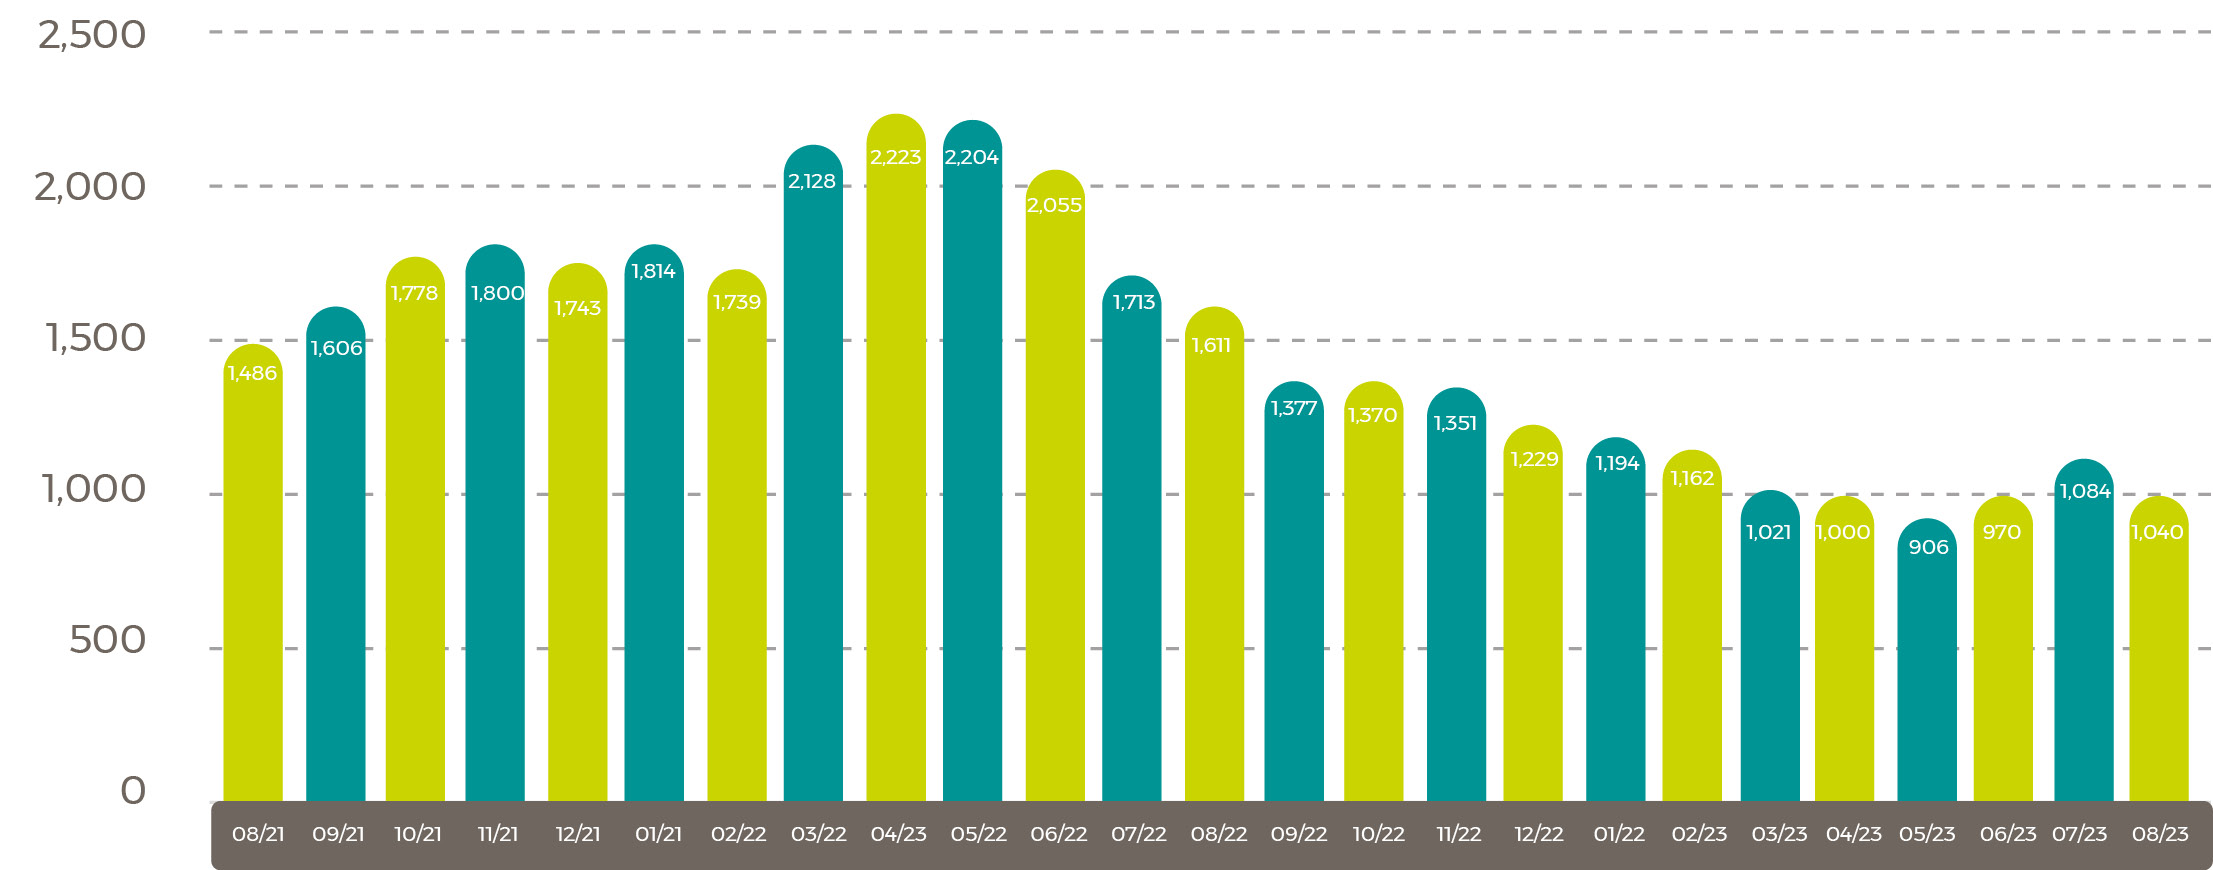 Sunflower oil
Average 2021/23 Sunflower Seed Oil Prices $/tonne
Shipping Update
Global container rates have decreased by 19% since the end of September
From the September 28, 2023, Drewry World Container Index report:
- Drewry WCI composite index decreased from $1,740 per 40-foot container on August 31 to $1,404 by September 28, for a 19% decrease throughout September
- The latest Drewry WCI composite index of $1,404.38 per 40-foot container is now 1% below than average 2019 (pre-pandemic) rates of $1,420
- The average composite index for the year-to-date is $1,747 per 40ft container, which is $932 lower than the 10-year average rates of $2,678
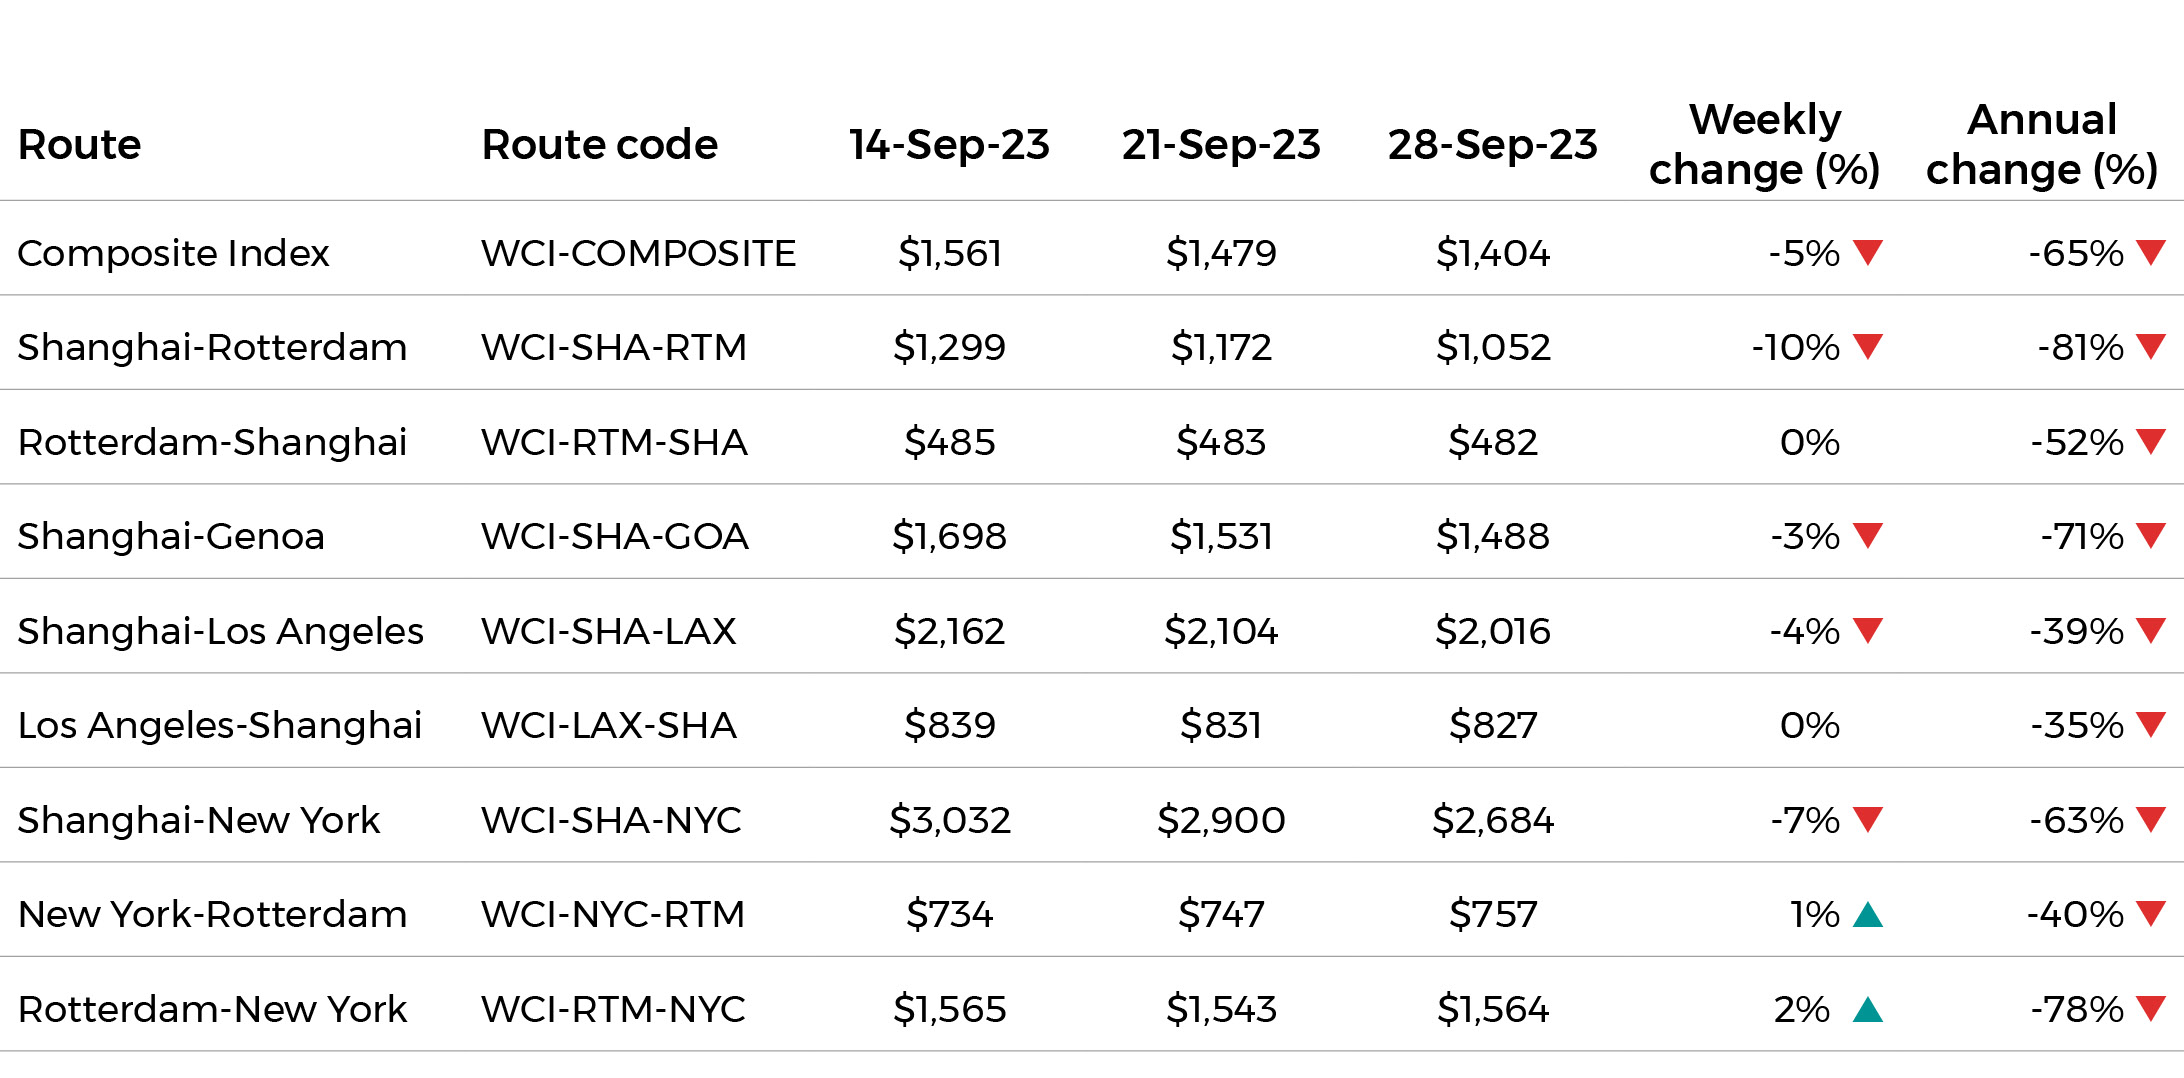
Source: Drewry Supply Chain Advisors
View Drewry shipping data here.
Disclaimer: The information in this document has been obtained from or based upon sources believed to be reliable and accurate at the time of writing. The document should be for information purposes only and is not guaranteed to be accurate or complete.