Palm and other vegetable oil prices slip in October
November 4, 2026
1 RM (Malaysian Ringgit) = 0.25 USD
1 USD = 0.74 GBP
*Exchange rates calculated and market prices reported on Nov. 4, 2026
Palm and other vegetable oil prices slip in October
Crude Palm Oil
Average World Bank October 2026 palm oil price
US$1120/tonne (-US$60 in month, a decrease of 5.1%)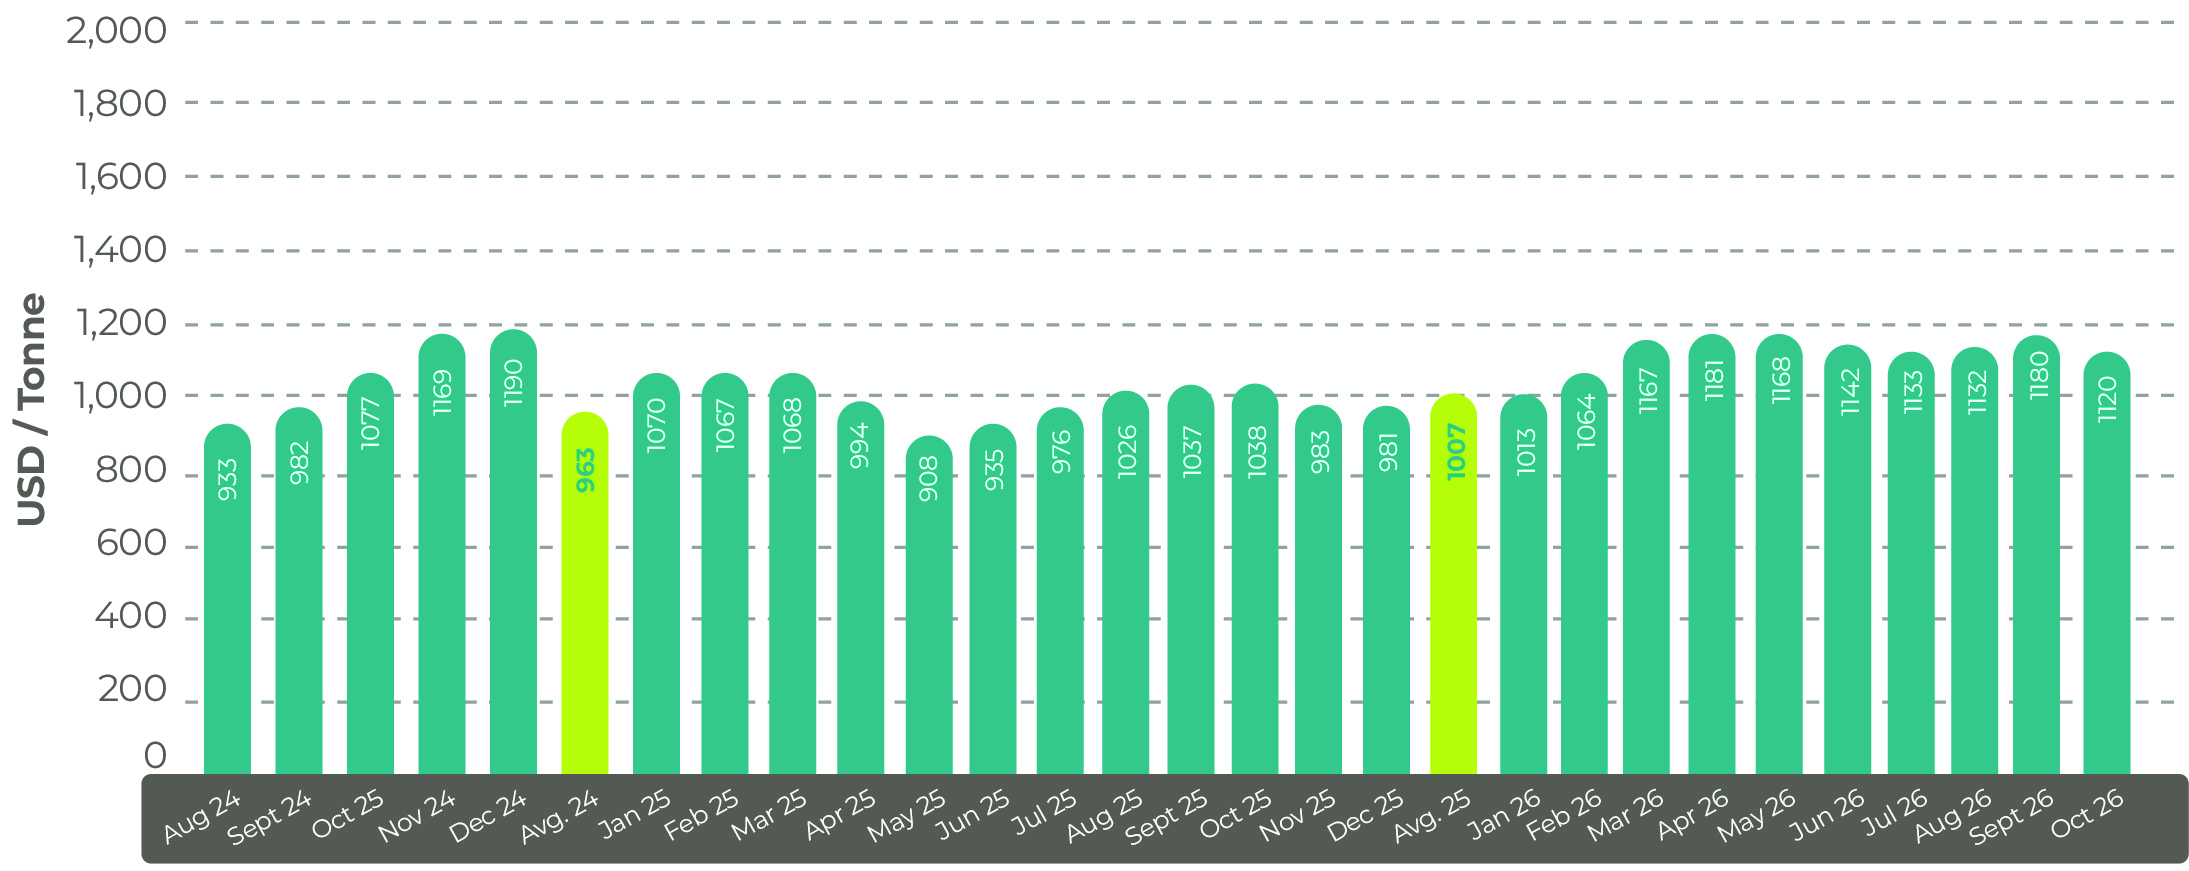
Malaysia palm market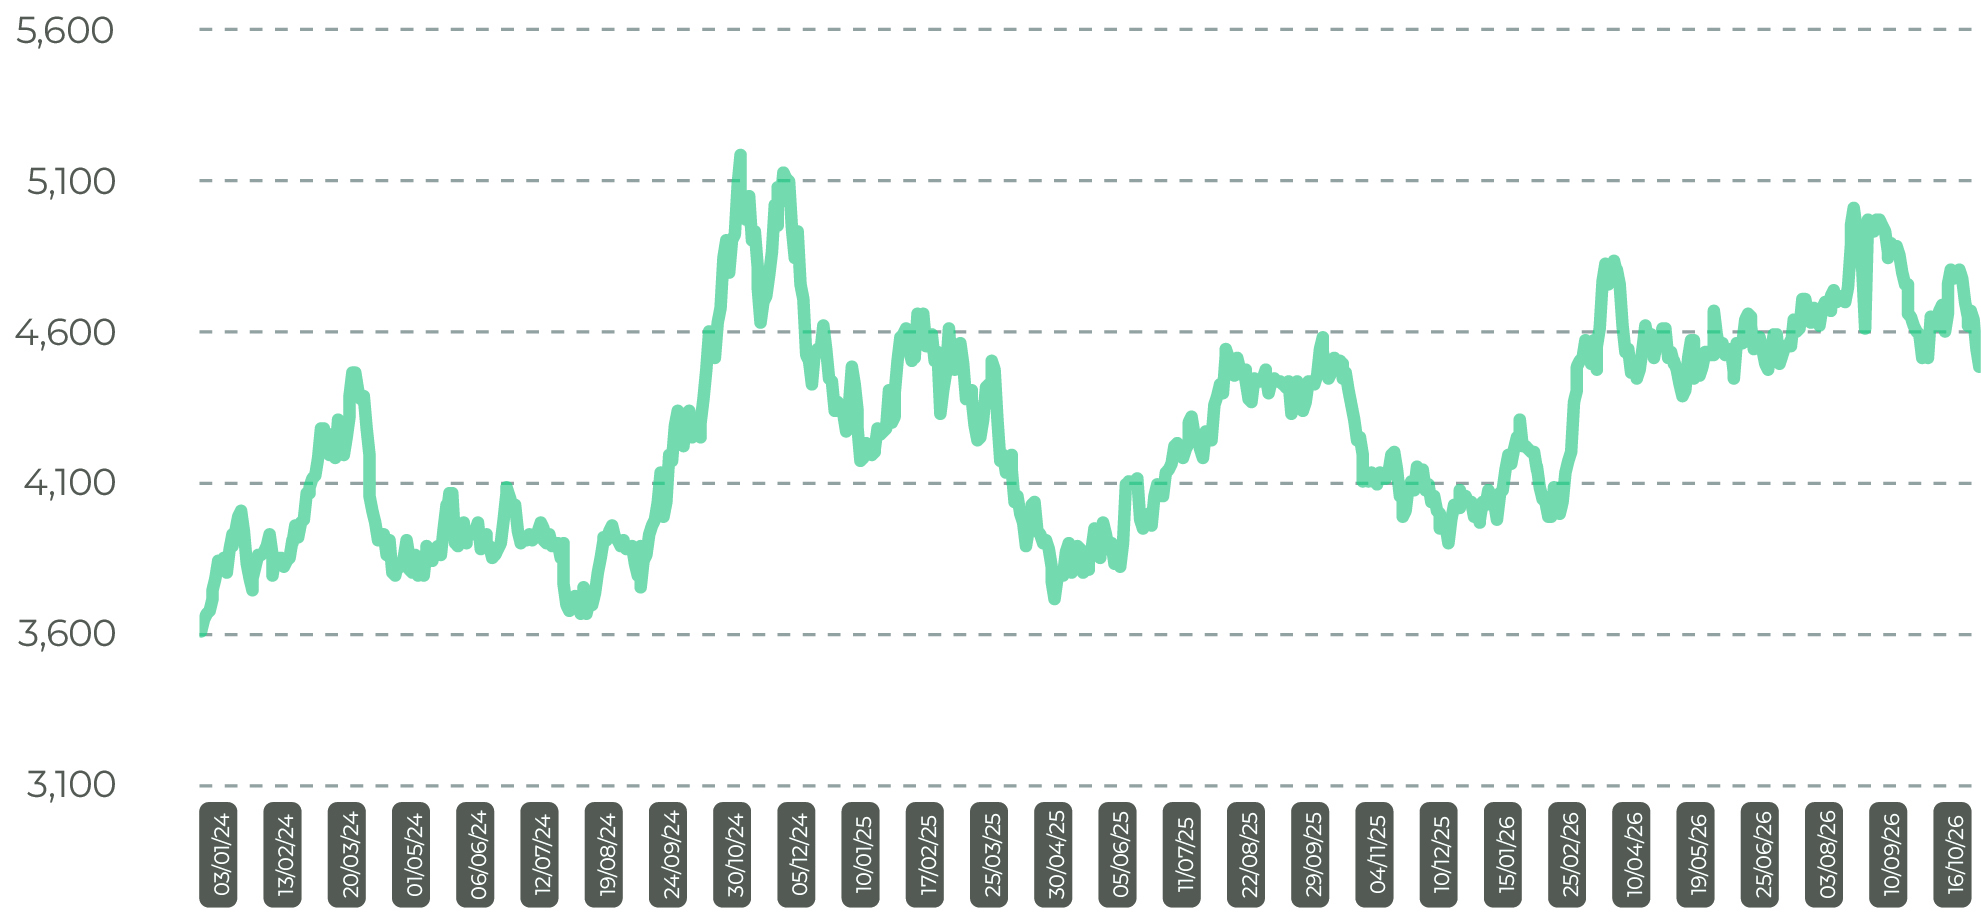
After a small surge in palm oil prices in the second part of October, values slipped in early November. By Nov. 4, the Malaysian Palm Oil Settlement price was at RM4,496/tonne (US$1,124), the lowest it had been since early July 2026.
The price had peaked at RM4,815/tonne (US$1,204) on the Oct. 20, the highest it had been for a month, but then started falling. The latest price of RM4,496/tonne (US$1,124) was only 0.8% lower than a month earlier and 8.6% higher than a year earlier. However, it was 10.4% below the 2026 peak seen in late August and 36.8% below the all-time high set in April 2022.
The drop in prices was attributed to large and growing stocks of Malaysian palm oil, despite strong exports during October.
Vegetable oil
Vegetable oil prices fall as crude oil prices hold firm
There was pressure on global vegetable oil prices in October, although values were still stronger than the year before. The average global palm oil price was US$1,120/tonne in October, 5.1% lower than the previous month, but 7.9% higher than in October 2025, according to the World Bank. Palm kernel oil prices fell 2.9% over the month and were 0.6% higher than a year earlier at US$2,287/tonne.
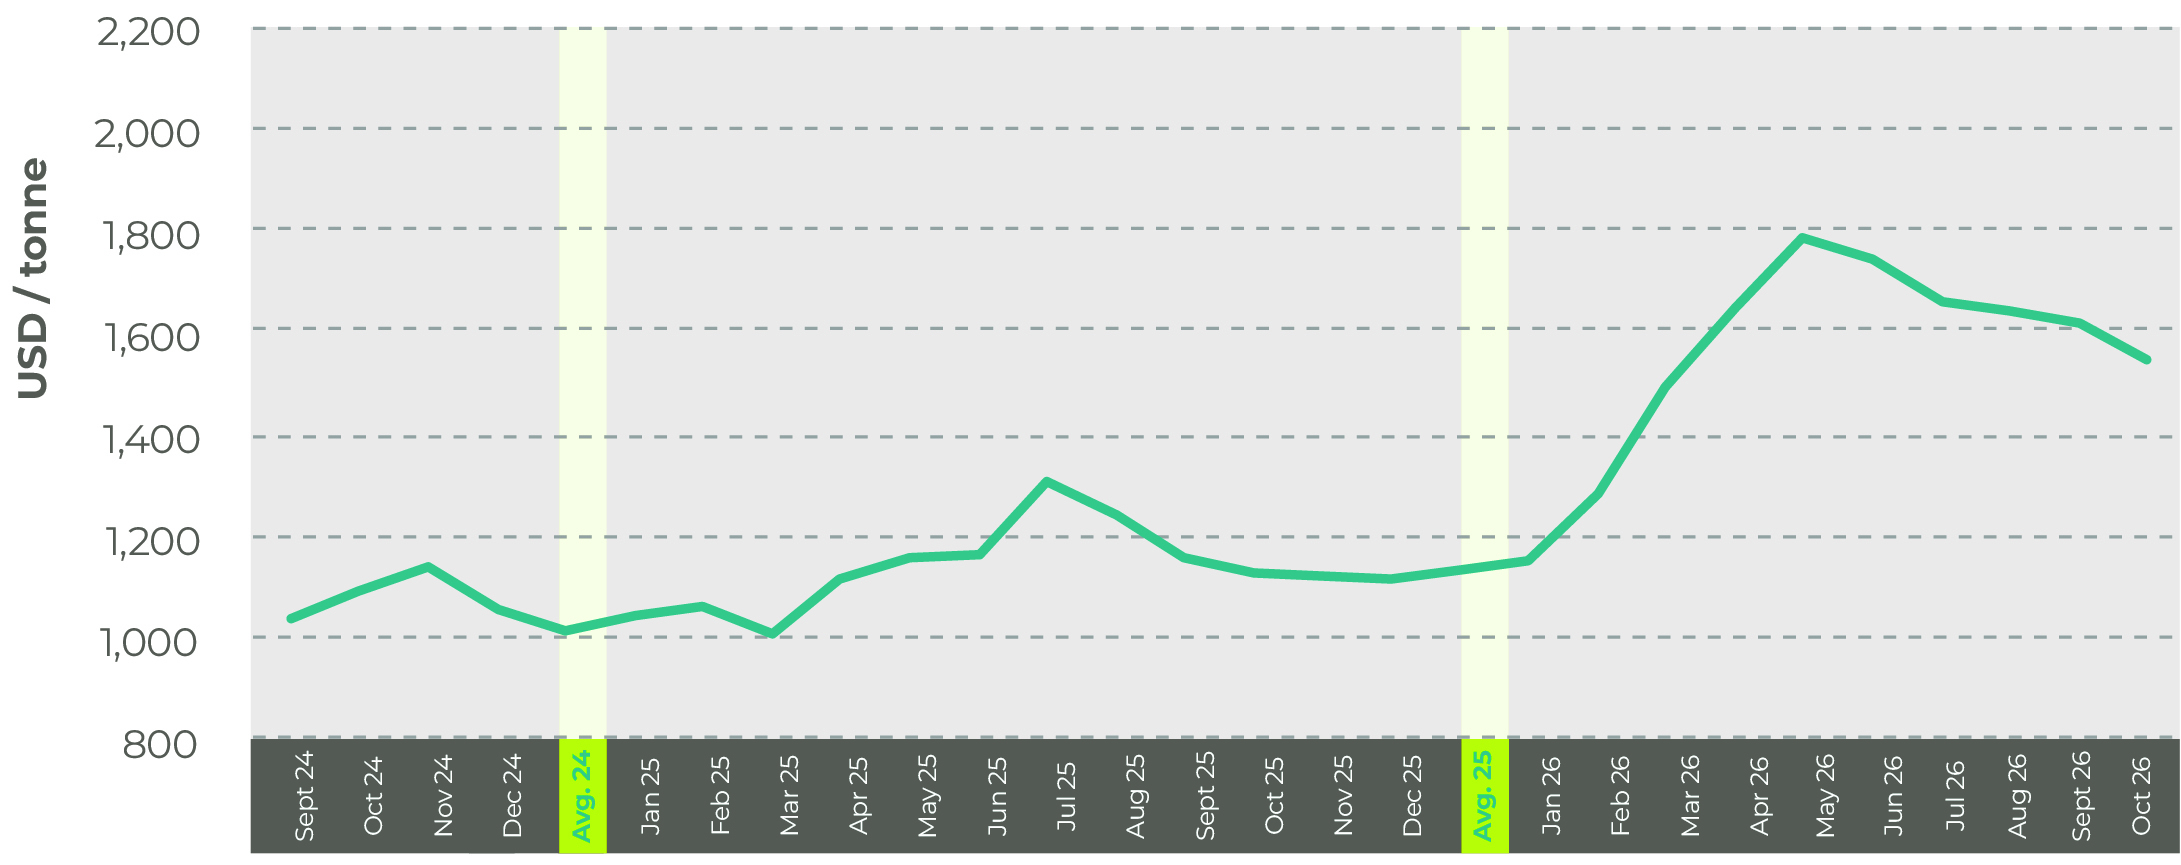
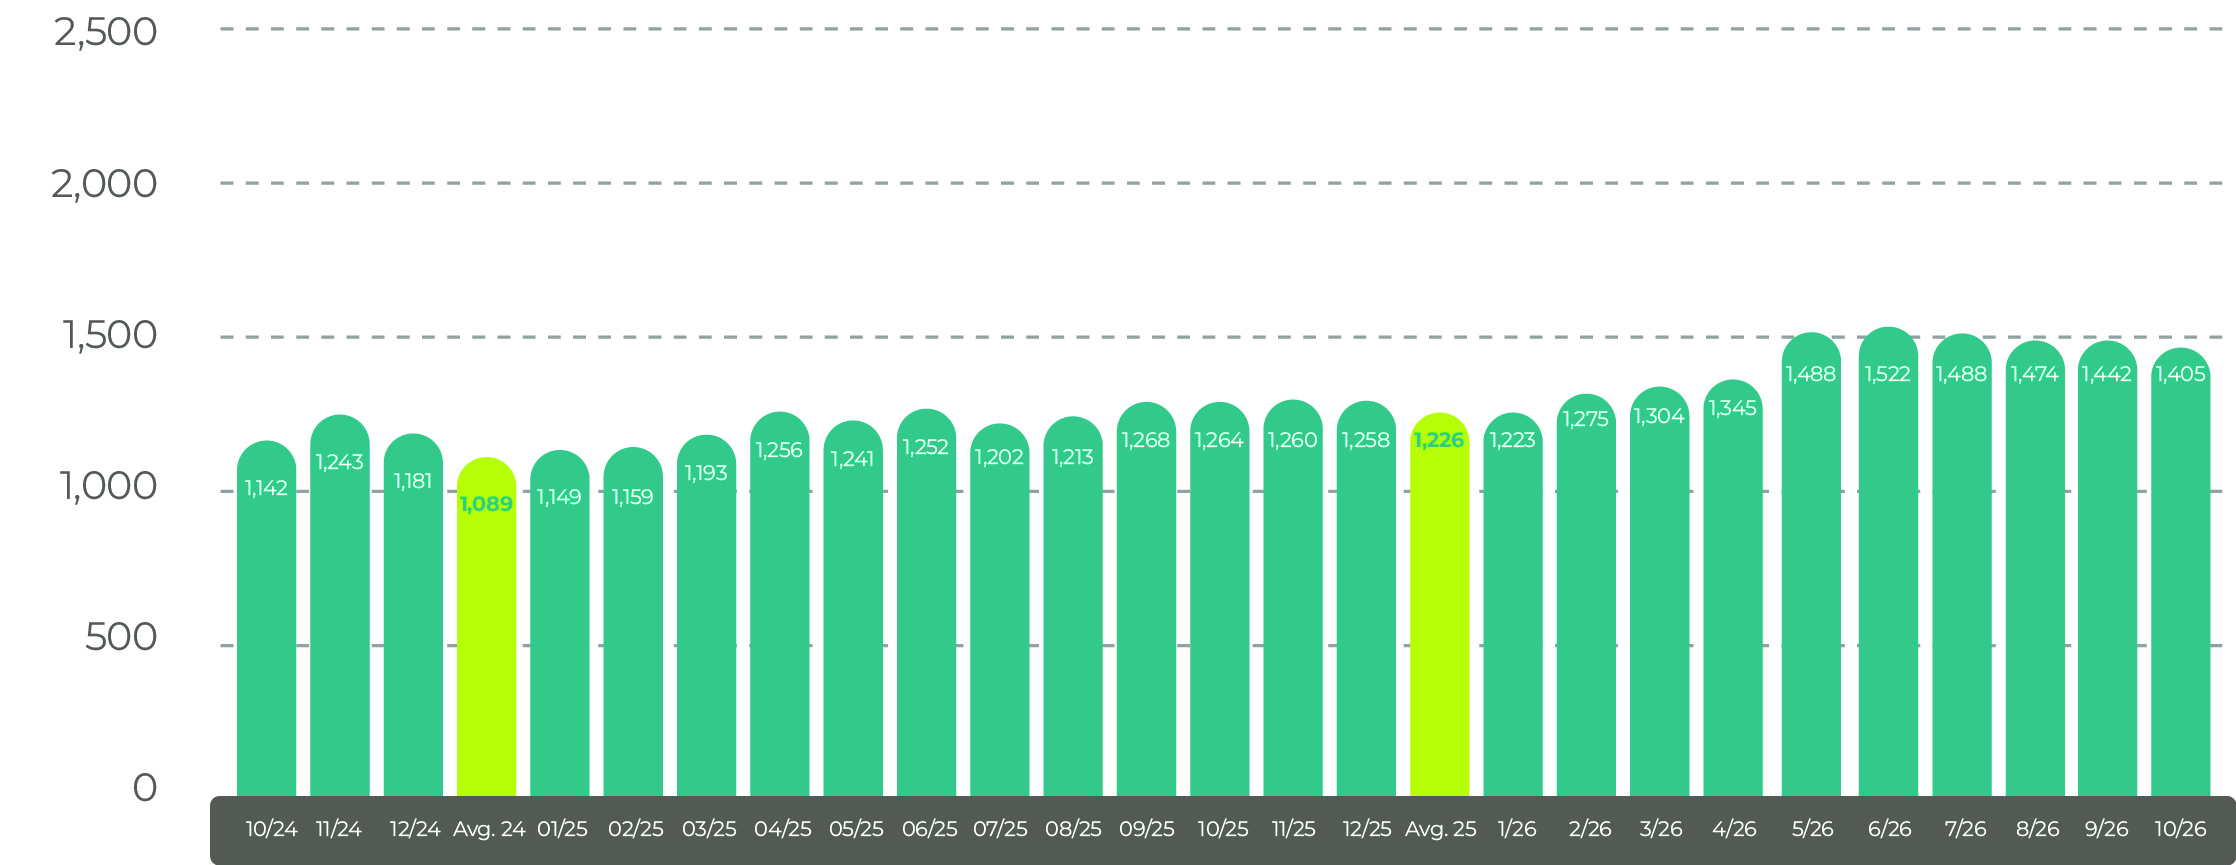
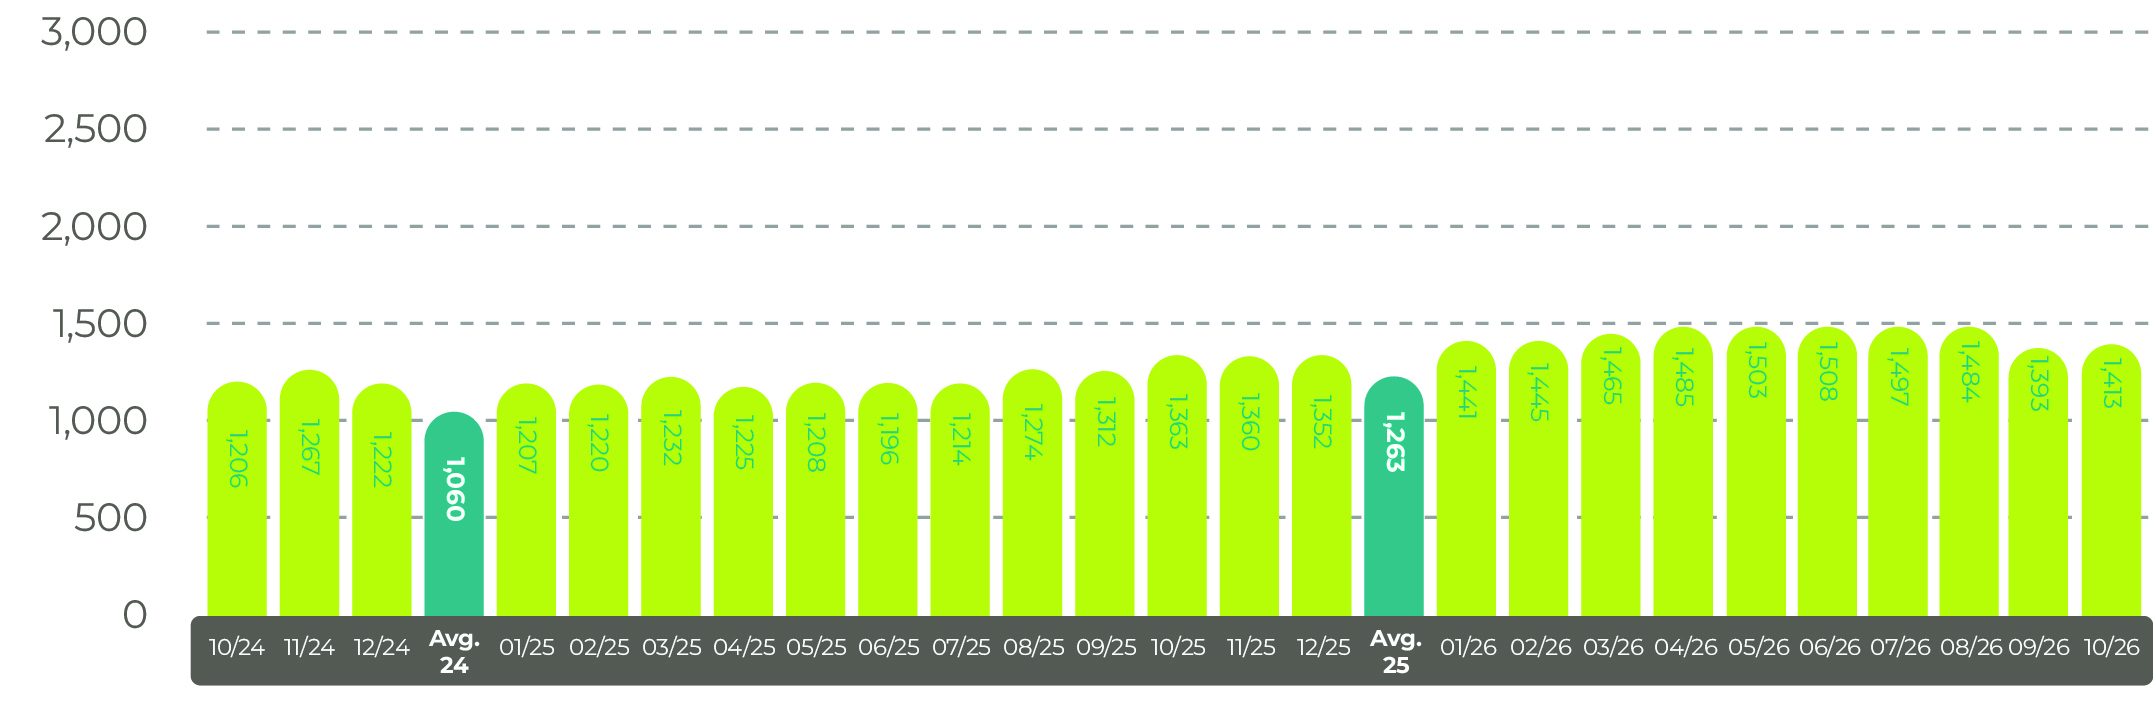
Average crude oil prices rose 6.1% over October to US$108.50 a barrel, which was 72.2% higher than a year earlier. Prices have eased in early November. Soybean oil prices fell 4.3% in the month and were up 36.6% over the year to US$1,546/tonne. There was a 2.6% drop in rapeseed oil prices in the month to US$1,405/tonne, which was 11.2% higher than a year earlier. Sunflower oil prices were up 1.4% in the month and 3.7% over the year to US$1,413/tonne.
The U.S. Department of Agriculture forecasts global soybean production to increase to 442.7 million tonnes in 2026/27, as higher U.S. output outweighs reductions in India and the EU. Global crush and exports also rise, while ending stocks increase by 0.3 million tonnes to 124.3 million. Indonesia’s palm oil production falls by 2.2 million tonnes to 45 million following several months of dry weather. Global palm oil output is forecast to decline by 2.5 million tonnes from the previous marketing year, leaving global stocks at the lowest since 2017/18.
Compared with USDA estimates for 2025/26, total oilseed output for 2026/27 is forecast to rise 3.0% to 722.2 million tonnes, supply 2.6% to 867.6 million tonnes, trade 2.3% to 221.6 million tonnes, global use is forecast to rise 3.1% to 611.9 million tonnes, and ending stocks are forecast to rise 0.6% to 146.3 million tonnes.
Oilmeal stocks are forecast to increase by 3.4% to 24.8 million tonnes. Vegetable oil output climbs 1.3% to 243.2 million tonnes, supply 1.3% to 273.8 million tonnes, trade 0.8% to 90.8 million tonnes, and use 2.9% to 237.3 million tonnes, but stocks fall 2.3% to 29.9 million tonnes, indicating tighter inventories.
Soybean oil
 Rapeseed oil
Sunflower oil
Shipping update
Shipping prices still high driven by strong China to US values
Average global shipping costs remained high for most of October but there was some mild weakening in the latter part of the month. The Drewry World Container Index price in the week ending Oct. 29, 2026 was US$4,429 per 40-foot container, 143% higher than a year earlier after a rapid rise in costs from April onwards. The latest price was down 3.0% from the previous week.
Among the routes tracked by the index, Shanghai-to-U.S. rates were much higher than Shanghai-to-Europe rates. The Shanghai-to-New York price was US$9,631/40-foot container in the latest week, with the route to Los Angeles at US$7,514. Meanwhile the Shanghai to Genoa, Italy, route was US$4,151 and the route to Rotterdam was US$3,686.
From the Oct. 29, 2026 Drewry World Container Index report:
- The Drewry World Container Index (WCI), the benchmark widely referenced by procurement teams, decreased 3% to $4,429 per 40-foot container, mainly due to a decrease in rates on the Transpacific trade route.
- On the Transpacific trade route, rates from Shanghai to Los Angeles fell 6% to $7,514 per 40-foot container, and those from Shanghai to New York decreased 5% to $9,631 per 40-foot container. According to Drewry’s Container Capacity Insight, six blank sailings have been announced for next week, up from five this week, indicating tight capacity. Meanwhile, strong U.S. import demand is easing. According to the U.S. National Retail Federation, US ocean import volumes are forecast to decrease 11% MoM in November, which could put further downward pressure on freight rates. Hence, Drewry expects rates to decrease next week.
- On the Asia–Europe trade route, rates from Shanghai to Rotterdam inched up 1% to $3,686 per 40-foot container, and those from Shanghai to Genoa remained stable at $4,151 per 40-foot container. According to Drewry’s Container Capacity Insight, four blank sailings have been announced for next week, down from eight this week, indicating more effective capacity. Carriers are announcing higher FAK rates for November; however, given available capacity and weak demand, it remains uncertain whether these increases will hold. Hence, Drewry expects rates to remain stable next week.
- The East-West container freight market remains under pressure. Transits through the Suez Canal increased to 62 vessels last week—the highest weekly level this year. However, disruptions in the Strait of Hormuz continue, with only two vessels transiting the strait of Hormuz last week. Congestion at Shanghai port is easing, although Typhoon Champi could disrupt this improvement. Overall, weak demand, capacity management by carriers, potential surcharges, and ongoing US trade policy developments will continue to influence freight rates in the coming weeks.
Source: Drewry Supply Chain Advisors
Disclaimer: The information in this document has been obtained from or based upon sources believed to be reliable and accurate at the time of writing. The document should be for information purposes only and is not guaranteed to be accurate or complete.